
- 0133技术站
- 联系QQ:18840023
- QQ交流群

- 微信公众号


 云罗郡主
更新时间:2019-01-16 11:03:06
云罗郡主
更新时间:2019-01-16 11:03:06
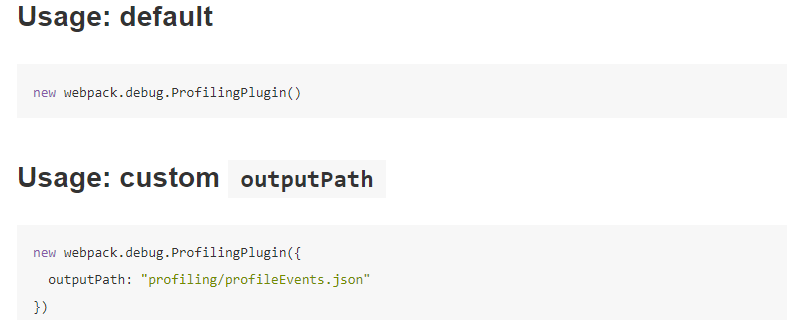
Generate Chrome profile file which includes timings of plugins execution. Outputs events.json file by default. It is possible to provide custom file path using outputPath option.
outputPath: A relative path to a custom output file (json)new webpack.debug.ProfilingPlugin()
outputPathnew webpack.debug.ProfilingPlugin({
outputPath: "profiling/profileEvents.json"})In order to view the profile file:
ProfilingPlugin.Profile Tab.events.json by default) into the profiler.It will then display timeline stats and calls per plugin!
推荐手册