这篇文章主要为大家介绍了R语言如何利用ggplot2绘制QQ图和箱线图,文中的示例代码讲解详细,对我们学习R语言有一定的帮助,需要的可以参考一下
绘制qq图
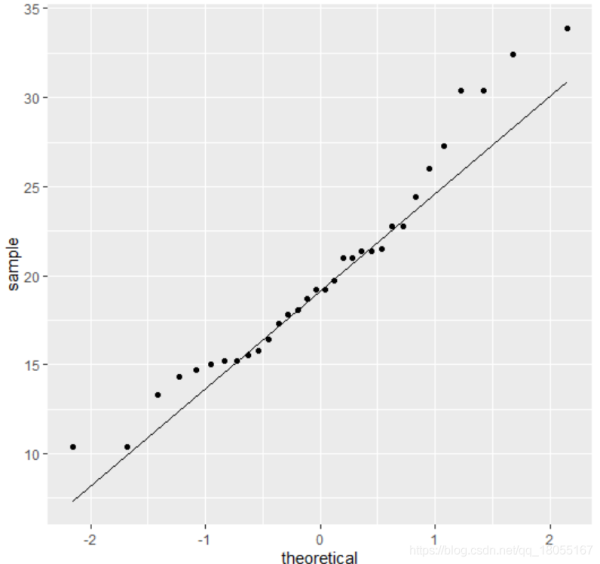
在ggplot2中绘制qq图需要两步,geom_qq()将绘制样本分位点,geom_qq_line()将绘制标准正态线
函数介绍
geom_qq()
geom_qq( mapping = NULL, data = NULL, geom = "point", position = "identity", ..., distribution = stats::qnorm, dparams = list(), na.rm = FALSE, show.legend = NA, inherit.aes = TRUE )
geom_qq_line( mapping = NULL, data = NULL, geom = "path", position = "identity", ..., distribution = stats::qnorm, dparams = list(), line.p = c(0.25, 0.75), fullrange = FALSE, na.rm = FALSE, show.legend = NA, inherit.aes = TRUE )
参数介绍
**aes()**中的映射参数必须包含sample,可选参数有group,x,y distribution
Distribution function to use, if x not specified
dparams Additional parameters passed on to distribution function.
line.p Vector of quantiles to use when fitting the Q-Q line, defaults defaults to c(.25, .75).
fullrange Should the q-q line span the full range of the plot, or just the data
注意事项
**aes()**中的映射参数必须包含sample
例子
Using to explore the distribution of a variable
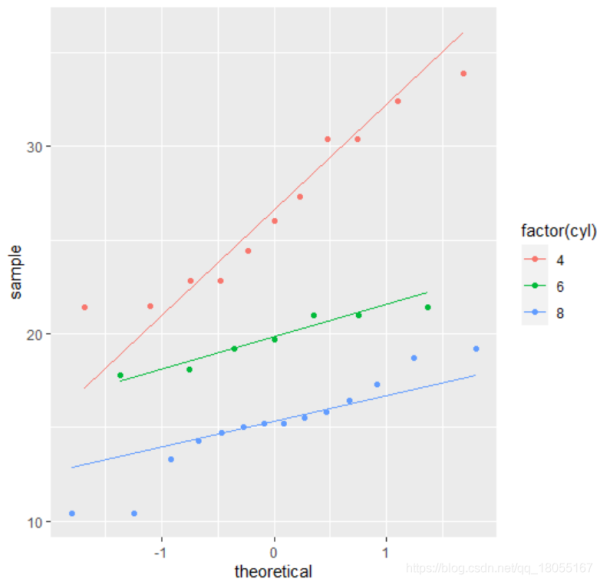
ggplot(mtcars, aes(sample = mpg)) + stat_qq() + stat_qq_line() ggplot(mtcars, aes(sample = mpg, colour = factor(cyl))) + stat_qq() + stat_qq_line()
绘制boxplot
函数介绍
geom_boxplot( mapping = NULL, data = NULL, stat = "boxplot", position = "dodge2", ..., outlier.colour = NULL, outlier.color = NULL, outlier.fill = NULL, outlier.shape = 19, outlier.size = 1.5, outlier.stroke = 0.5, outlier.alpha = NULL, notch = FALSE, notchwidth = 0.5, varwidth = FALSE, na.rm = FALSE, orientation = NA, show.legend = NA, inherit.aes = TRUE )
参数介绍
aes()可接收的参数有:
- x or y, 利用x将会是横向箱线图,y的是纵向
- lower or xlower
- upper or xupper
- middle or xmiddle
- ymin or xmin
- ymax or xmax
- alpha
- colour
- fill
- group
- linetype
- shape
- size
- weight
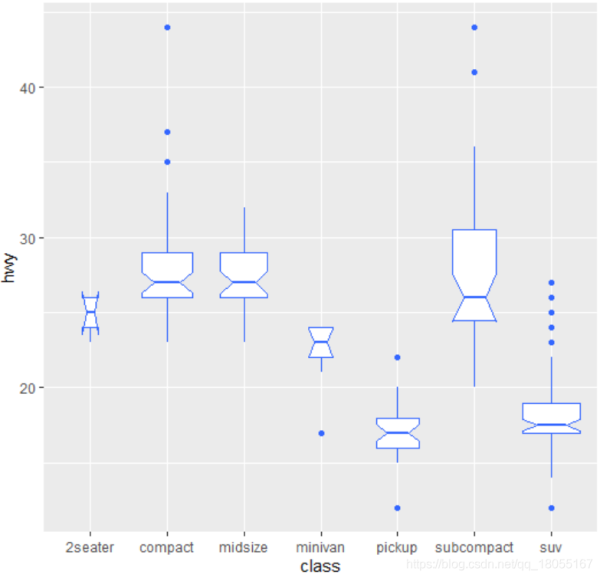
notch If FALSE (default) make a standard box plot. If TRUE, make a notched box plot. Notches are used to compare groups; if the notches
of two boxes do not overlap, this suggests that the medians are
significantly different.
notchwidth For a notched box plot, width of the notch relative to the body (defaults to notchwidth = 0.5).
varwidth If FALSE (default) make a standard box plot. If TRUE, boxes are drawn with widths proportional to the square-roots of the
number of observations in the groups (possibly weighted, using the
weight aesthetic).
例子
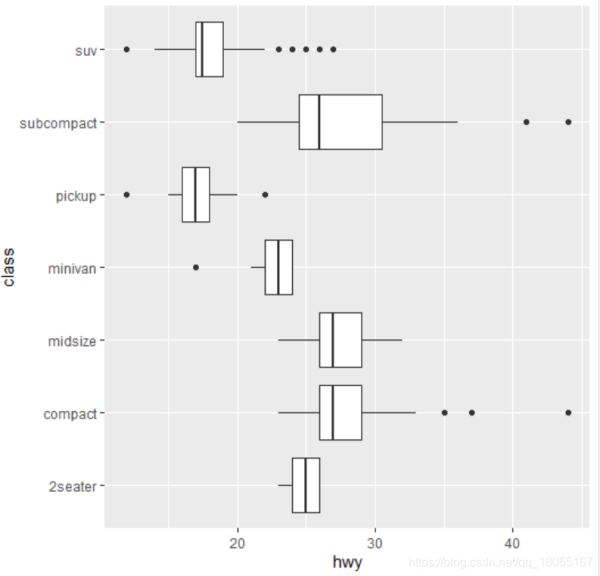
p <- ggplot(mpg, aes(x=class, y=hwy)) p + geom_boxplot()

ggplot(mpg, aes(x=hwy, y=class)) + geom_boxplot()
p <- ggplot(mpg, aes(x=class, y=hwy)) p + geom_boxplot(notch = TRUE,varwidth = TRUE,fill = "white", colour = "#3366FF")
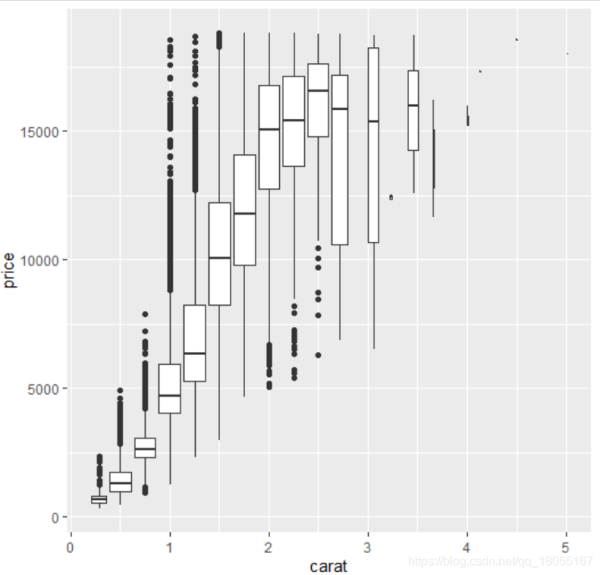
ggplot(diamonds, aes(carat, price)) + geom_boxplot(aes(group = cut_width(carat, 0.25)))
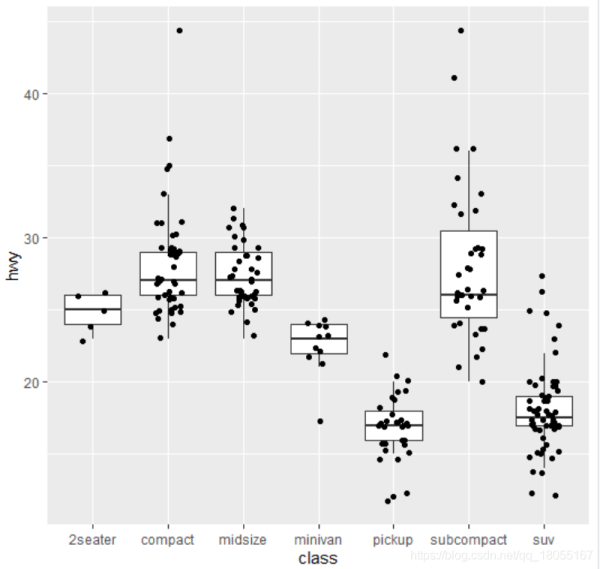
p <- ggplot(mpg, aes(x=class, y=hwy)) p + geom_boxplot(outlier.shape = NA) + geom_jitter(width = 0.2)
利用分位点绘制箱线图
y <- rnorm(100) df <- data.frame( x = 1, y0 = min(y), y25 = quantile(y, 0.25), y50 = median(y), y75 = quantile(y, 0.75), y100 = max(y) ) ggplot(df, aes(x)) + geom_boxplot( aes(ymin = y0, lower = y25, middle = y50, upper = y75, ymax = y100), stat = "identity" )

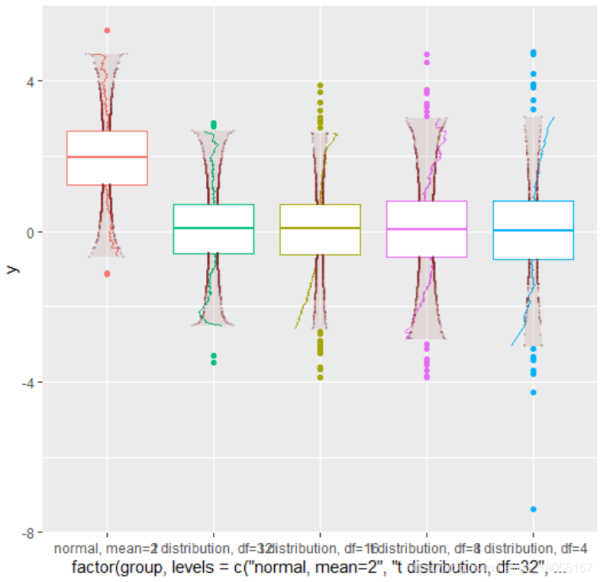
将QQ图和箱线图进行融合
函数介绍
该函数是来自于qqboxplot包,因此使用前需要安装
geom_qqboxplot( mapping = NULL, data = NULL, stat = "qqboxplot", position = "dodge2", ..., outlier.colour = NULL, outlier.color = NULL, outlier.fill = NULL, outlier.shape = 19, outlier.size = 1.5, outlier.stroke = 0.5, outlier.alpha = NULL, notch = FALSE, notchwidth = 0.5, varwidth = FALSE, na.rm = FALSE, show.legend = NA, inherit.aes = TRUE )
参数介绍
大部分参数和geom_qq()和geom_boxplot()中的参数含义相同
reference_dist 表示参数比较的标准分布名称,如果有参数需要有dparams
compdata 用于比较的标准样本数据,是个向量
注意事项
aes()函数中的y不可缺
例子
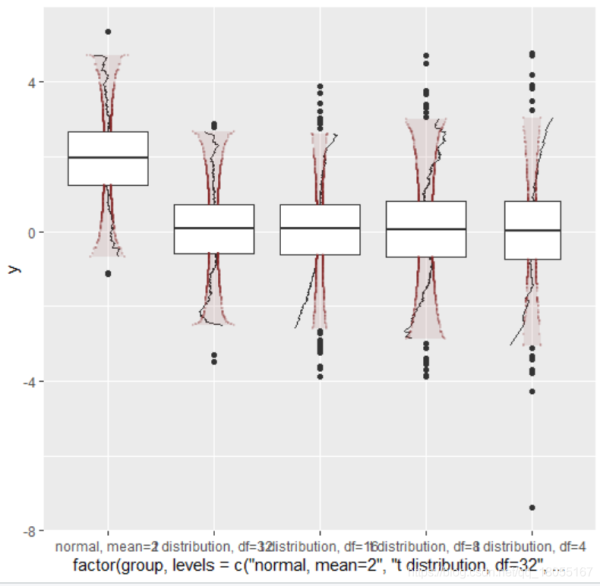
library(dplyr) library(ggplot2) library(qqboxplot) simulated_data=tibble(y=c(rnorm(1000, mean=2), rt(1000, 16), rt(500, 4), rt(1000, 8), rt(1000, 32)), group=c(rep("normal, mean=2", 1000), rep("t distribution, df=16", 1000), rep("t distribution, df=4", 500), rep("t distribution, df=8", 1000), rep("t distribution, df=32", 1000))) p <- ggplot2::ggplot(simulated_data, ggplot2::aes(factor(group, levels=c("normal, mean=2", "t distribution, df=32", "t distribution, df=16", "t distribution, df=8", "t distribution, df=4")), y=y)) p + geom_qqboxplot() p + geom_qqboxplot(reference_dist = "norm") p + geom_qqboxplot(compdata = comparison_dataset) 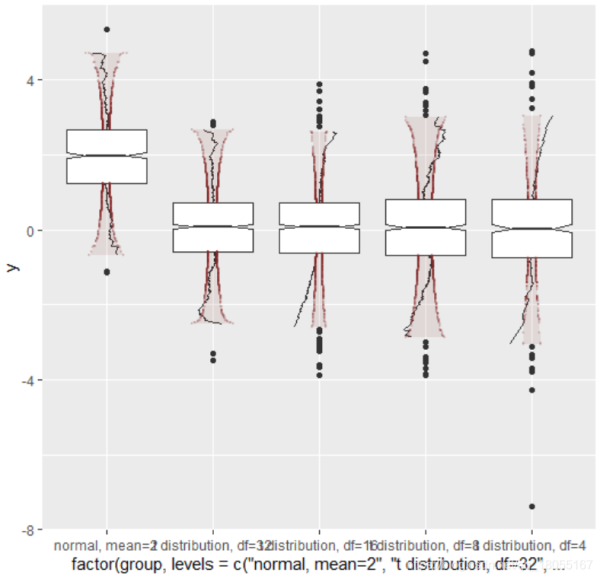
以上就是R语言利用ggplot2绘制QQ图和箱线图详解的详细内容,更多关于R语言绘制QQ图 箱线图的资料请关注0133技术站其它相关文章!
以上就是R语言利用ggplot2绘制QQ图和箱线图详解的详细内容,更多请关注0133技术站其它相关文章!


