这篇文章主要介绍了Python Matplotlib通过plt.subplots创建子绘图,plt.subplots调用后将会产生一个图表和默认网格,与此同时提供一个合理的控制策略布局子绘图,更多相关需要的朋友可以参考下面文章内容
前言
plt.subplots调用后将会产生一个图表(Figure)和默认网格(Grid),与此同时提供一个合理的控制策略布局子绘图。
一、只有子图的绘制
如果没有提供参数给subplots将会返回:
Figure一个Axes对象
例子:
fig, ax = plt.subplots() ax.plot(x, y) ax.set_title('A single plot')
二、单个方向堆叠子图
堆叠子图就需要用到额外的可选参数,分别是子图的行和列数,如果你只传递一个数字,默认列数为1,行堆叠。
比如:
fig, axs = plt.subplots(2) fig.suptitle('Vertically stacked subplots') axs[0].plot(x, y) axs[1].plot(x, -y)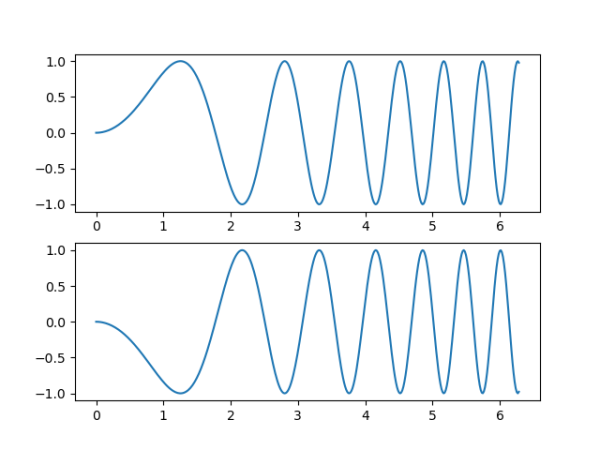
当然如果你的子图比较少,可以考虑用元组接收axes对象:
fig, (ax1, ax2) = plt.subplots(2) fig.suptitle('Vertically stacked subplots') ax1.plot(x, y) ax2.plot(x, -y)如果想要按照行排列,将参数改成(1,2)即可。
三、行列方向扩展子图
如果行列扩展子图,那么axes返回的则是一个二维Numpy数组。利用axe的flat属性,可以批量对轴进行赋值。
fig, axs = plt.subplots(2, 2) axs[0, 0].plot(x, y) axs[0, 0].set_title('Axis [0, 0]')# 等价于axes[0][0] axs[0, 1].plot(x, y, 'tab:orange') axs[0, 1].set_title('Axis [0, 1]') axs[1, 0].plot(x, -y, 'tab:green') axs[1, 0].set_title('Axis [1, 0]') axs[1, 1].plot(x, -y, 'tab:red') axs[1, 1].set_title('Axis [1, 1]') for ax in axs.flat: ax.set(xlabel='x-label', ylabel='y-label') # Hide x labels and tick labels for top plots and y ticks for right plots. for ax in axs.flat: ax.label_outer()当然你可以用单个轴对象接收:
fig, ((ax1, ax2), (ax3, ax4)) = plt.subplots(2, 2) fig.suptitle('Sharing x per column, y per row') ax1.plot(x, y) ax2.plot(x, y**2, 'tab:orange') ax3.plot(x, -y, 'tab:green') ax4.plot(x, -y**2, 'tab:red') for ax in fig.get_axes(): ax.label_outer()四、共享轴
默认情况下,每个子图都是独立创建的。
看下面这个例子:
fig, (ax1, ax2) = plt.subplots(2) fig.suptitle('Axes values are scaled individually by default') ax1.plot(x, y) ax2.plot(x + 1, -y)
可以看出两者的横坐标刻度并不对齐,那么应该如何设置共享?答:在subplot创建之时使用sharex=True和sharedy=True分别创建X轴共享或者Y轴共享。
将上边的例子修改为以下:
fig, (ax1, ax2) = plt.subplots(2, sharex=True) fig.suptitle('Aligning x-axis using sharex') ax1.plot(x, y) ax2.plot(x + 1, -y)结果如下:

OK,看上去确实统一了坐标轴,除此,python帮你移除了多余的坐标刻度,上面中间的刻度被删除了。
如果你觉得中间的留白不太舒服的话,也有办法去除。方法是通过GridSpec对象,但是使用上就比较麻烦了,因为你需要自己创建一个figure并使用add_gridspec返回这个对象,然后再通过subplot进行接下来的操作。
直接看例子吧:
fig = plt.figure() gs = fig.add_gridspec(3, hspace=0) axs = gs.subplots(sharex=True, sharey=True) fig.suptitle('Sharing both axes') axs[0].plot(x, y ** 2) axs[1].plot(x, 0.3 * y, 'o') axs[2].plot(x, y, '+') # Hide x labels and tick labels for all but bottom plot. for ax in axs: ax.label_outer()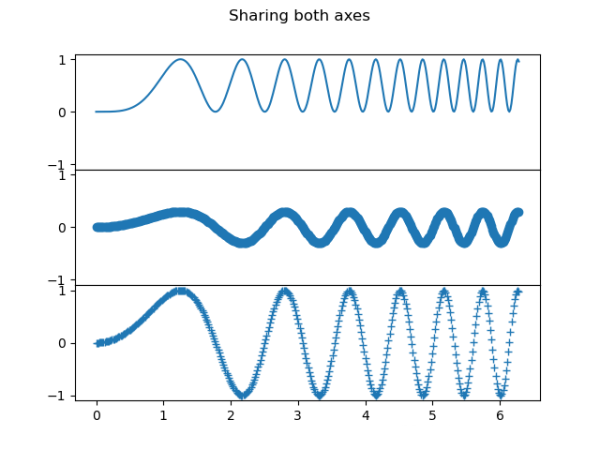
这里还用到了轴的label_outer方法,这是用来隐藏非边界的坐标轴的。“share”在这里的意思是:共享一个坐标轴,也就意味着刻度的位置是对齐的。
请注意,修改sharex和sharey是全局修改的,所以你如果想让每一行和每一列共享一个坐标轴,可以考虑用sharex='col', sharey='row'。
fig = plt.figure() gs = fig.add_gridspec(2, 2, hspace=0, wspace=0) (ax1, ax2), (ax3, ax4) = gs.subplots(sharex='col', sharey='row') fig.suptitle('Sharing x per column, y per row') ax1.plot(x, y) ax2.plot(x, y**2, 'tab:orange') ax3.plot(x + 1, -y, 'tab:green') ax4.plot(x + 2, -y**2, 'tab:red') for ax in axs.flat: ax.label_outer()
如果你需要关联更加复杂的共享轴关系,可以创建出来使用axe的成员sharex、sharey进行设置:
fig, axs = plt.subplots(2, 2) axs[0, 0].plot(x, y) axs[0, 0].set_title("main") axs[1, 0].plot(x, y**2) axs[1, 0].set_title("shares x with main") axs[1, 0].sharex(axs[0, 0]) axs[0, 1].plot(x + 1, y + 1) axs[0, 1].set_title("unrelated") axs[1, 1].plot(x + 2, y + 2) axs[1, 1].set_title("also unrelated") fig.tight_layout()# 让绘图更加紧凑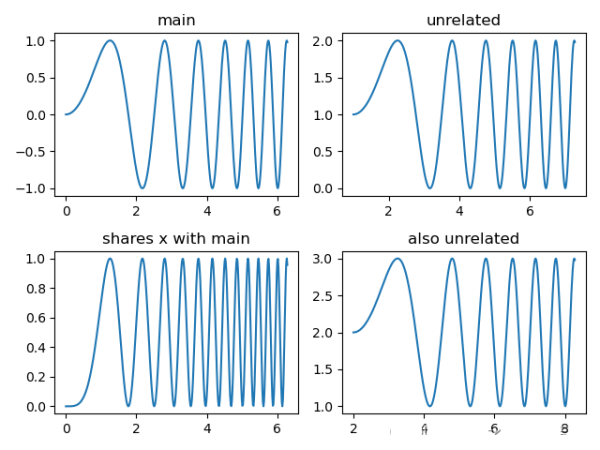
五、极坐标子图
fig, (ax1, ax2) = plt.subplots(1, 2, subplot_kw=dict(projection='polar')) ax1.plot(x, y) ax2.plot(x, y ** 2) plt.show()

到此这篇关于Python Matplotlib通过plt.subplots创建子绘图的文章就介绍到这了,更多相关Python创建子绘图内容请搜索0133技术站以前的文章或继续浏览下面的相关文章希望大家以后多多支持0133技术站!
以上就是Python Matplotlib通过plt.subplots创建子绘图的详细内容,更多请关注0133技术站其它相关文章!


