这篇文章主要介绍了人工智能—Python实现线性回归,人工智能分为类型、数据集、效果评估、等,线性回归根据随机初始化的 w x b 和 y 来计算 loss等步骤实现,下面来看看文章的具体实现吧
1、概述
(1)人工智能学习

(2)机器学习

(3)有监督学习

(4)线性回归

2、线性回归
(1)实现步骤
- 根据随机初始化的 w x b 和 y 来计算 loss
- 根据当前的 w x b 和 y 的值来计算梯度
- 更新梯度,循环将新的 w′ 和 b′ 复赋给 w 和 b ,最终得到一个最优的 w′ 和 b′ 作为方程最终的
(2)数学表达式

3、代码实现(Python)
(1)机器学习库(sklearn.linear_model)

代码:
from sklearn import linear_model from sklearn.linear_model import LinearRegression import matplotlib.pyplot as plt#用于作图 from pylab import * mpl.rcParams['font.sans-serif'] = ['SimHei'] mpl.rcParams['axes.unicode_minus'] = False import numpy as np#用于创建向量 reg=linear_model.LinearRegression(fit_intercept=True,normalize=False) x=[[32.50235],[53.4268],[61.53036],[47.47564],[59.81321],[55.14219],[52.14219],[39.29957], [48.10504],[52.55001],[45.41873],[54.35163],[44.16405],[58.16847],[56.72721]] y=[31.70701,68.7776,62.56238,71.54663,87.23093,78.21152,79.64197,59.17149,75.33124,71.30088,55.16568,82.47885,62.00892 ,75.39287,81.43619] reg.fit(x,y) k=reg.coef_#获取斜率w1,w2,w3,...,wn b=reg.intercept_#获取截距w0 x0=np.arange(30,60,0.2) y0=k*x0+b print("k={0},b={1}".format(k,b)) plt.scatter(x,y) plt.plot(x0,y0,label='LinearRegression') plt.xlabel('X') plt.ylabel('Y') plt.legend() plt.show()结果:
k=[1.36695374],b=0.13079331831460195

(2)Python详细实现(方法1)

代码:
#方法1 import numpy as np import matplotlib.pyplot as plt from pylab import * mpl.rcParams['font.sans-serif'] = ['SimHei'] mpl.rcParams['axes.unicode_minus'] = False #数据生成 data = [] for i in range(100): x = np.random.uniform(3., 12.) # mean=0, std=1 eps = np.random.normal(0., 1) y = 1.677 * x + 0.039 + eps data.append([x, y]) data = np.array(data) #统计误差 # y = wx + b def compute_error_for_line_given_points(b, w, points): totalError = 0 for i in range(0, len(points)): x = points[i, 0] y = points[i, 1] # computer mean-squared-error totalError += (y - (w * x + b)) ** 2 # average loss for each point return totalError / float(len(points)) #计算梯度 def step_gradient(b_current, w_current, points, learningRate): b_gradient = 0 w_gradient = 0 N = float(len(points)) for i in range(0, len(points)): x = points[i, 0] y = points[i, 1] # grad_b = 2(wx+b-y) b_gradient += (2/N) * ((w_current * x + b_current) - y) # grad_w = 2(wx+b-y)*x w_gradient += (2/N) * x * ((w_current * x + b_current) - y) # update w' new_b = b_current - (learningRate * b_gradient) new_w = w_current - (learningRate * w_gradient) return [new_b, new_w] #迭代更新 def gradient_descent_runner(points, starting_b, starting_w, learning_rate, num_iterations): b = starting_b w = starting_w # update for several times for i in range(num_iterations): b, w = step_gradient(b, w, np.array(points), learning_rate) return [b, w] def main(): learning_rate = 0.0001 initial_b = 0 # initial y-intercept guess initial_w = 0 # initial slope guess num_iterations = 1000 print("迭代前 b = {0}, w = {1}, error = {2}" .format(initial_b, initial_w, compute_error_for_line_given_points(initial_b, initial_w, data)) ) print("Running...") [b, w] = gradient_descent_runner(data, initial_b, initial_w, learning_rate, num_iterations) print("第 {0} 次迭代结果 b = {1}, w = {2}, error = {3}". format(num_iterations, b, w, compute_error_for_line_given_points(b, w, data)) ) plt.plot(data[:,0],data[:,1], color='b', marker='+', linestyle='--',label='true') plt.plot(data[:,0],w*data[:,0]+b,color='r',label='predict') plt.xlabel('X') plt.ylabel('Y') plt.legend() plt.show() if __name__ == '__main__': main() 结果:

迭代前 :b = 0, w = 0, error = 186.61000821356697
Running...
第 1000 次迭代结果:b = 0.20558501549252192, w = 1.6589067569038516, error = 0.9963685680112963
(3)Python详细实现(方法2)
代码:
#方法2 import numpy as np import pandas as pd import matplotlib.pyplot as plt import matplotlib as mpl mpl.rcParams["font.sans-serif"]=["SimHei"] mpl.rcParams["axes.unicode_minus"]=False # y = wx + b #Import data file=pd.read_csv("data.csv") def compute_error_for_line_given(b, w): totalError = np.sum((file['y']-(w*file['x']+b))**2) return np.mean(totalError) def step_gradient(b_current, w_current, learningRate): b_gradient = 0 w_gradient = 0 N = float(len(file['x'])) for i in range (0,len(file['x'])): # grad_b = 2(wx+b-y) b_gradient += (2 / N) * ((w_current * file['x'] + b_current) - file['y']) # grad_w = 2(wx+b-y)*x w_gradient += (2 / N) * file['x'] * ((w_current * file['x'] + b_current) - file['x']) # update w' new_b = b_current - (learningRate * b_gradient) new_w = w_current - (learningRate * w_gradient) return [new_b, new_w] def gradient_descent_runner( starting_b, starting_w, learning_rate, num_iterations): b = starting_b w = starting_w # update for several times for i in range(num_iterations): b, w = step_gradient(b, w, learning_rate) return [b, w] def main(): learning_rate = 0.0001 initial_b = 0 # initial y-intercept guess initial_w = 0 # initial slope guess num_iterations = 100 print("Starting gradient descent at b = {0}, w = {1}, error = {2}" .format(initial_b, initial_w, compute_error_for_line_given(initial_b, initial_w)) ) print("Running...") [b, w] = gradient_descent_runner(initial_b, initial_w, learning_rate, num_iterations) print("After {0} iterations b = {1}, w = {2}, error = {3}". format(num_iterations, b, w, compute_error_for_line_given(b, w)) ) plt.plot(file['x'],file['y'],'ro',label='线性回归') plt.xlabel('X') plt.ylabel('Y') plt.legend() plt.show() if __name__ == '__main__': main()结果:

Starting gradient descent at b = 0, w = 0, error = 75104.71822821398 Running... After 100 iterations b = 0 0.014845 1 0.325621 2 0.036883 3 0.502265 4 0.564917 5 0.479366 6 0.568968 7 0.422619 8 0.565073 9 0.393907 10 0.216854 11 0.580750 12 0.379350 13 0.361574 14 0.511651 dtype: float64, w = 0 0.999520 1 0.994006 2 0.999405 3 0.989645 4 0.990683 5 0.991444 6 0.989282 7 0.989573 8 0.988498 9 0.992633 10 0.995329 11 0.989490 12 0.991617 13 0.993872 14 0.991116 dtype: float64, error = 6451.5510231710905
数据:

(4)Python详细实现(方法3)
#方法3 import numpy as np points = np.genfromtxt("data.csv", delimiter=",") #从数据读入到返回需要两个迭代循环,第一个迭代将文件中每一行转化为一个字符串序列, #第二个循环迭代对每个字符串序列指定合适的数据类型: # y = wx + b def compute_error_for_line_given_points(b, w, points): totalError = 0 for i in range(0, len(points)): x = points[i, 0] y = points[i, 1] # computer mean-squared-error totalError += (y - (w * x + b)) ** 2 # average loss for each point return totalError / float(len(points)) def step_gradient(b_current, w_current, points, learningRate): b_gradient = 0 w_gradient = 0 N = float(len(points)) for i in range(0, len(points)): x = points[i, 0] y = points[i, 1] # grad_b = 2(wx+b-y) b_gradient += (2 / N) * ((w_current * x + b_current) - y) # grad_w = 2(wx+b-y)*x w_gradient += (2 / N) * x * ((w_current * x + b_current) - y) # update w' new_b = b_current - (learningRate * b_gradient) new_w = w_current - (learningRate * w_gradient) return [new_b, new_w] def gradient_descent_runner(points, starting_b, starting_w, learning_rate, num_iterations): b = starting_b w = starting_w # update for several times for i in range(num_iterations): b, w = step_gradient(b, w, np.array(points), learning_rate) return [b, w] def main(): learning_rate = 0.0001 initial_b = 0 # initial y-intercept guess initial_w = 0 # initial slope guess num_iterations = 1000 print("Starting gradient descent at b = {0}, w = {1}, error = {2}" .format(initial_b, initial_w, compute_error_for_line_given_points(initial_b, initial_w, points)) ) print("Running...") [b, w] = gradient_descent_runner(points, initial_b, initial_w, learning_rate, num_iterations) print("After {0} iterations b = {1}, w = {2}, error = {3}". format(num_iterations, b, w, compute_error_for_line_given_points(b, w, points)) ) if __name__ == '__main__': main()4、案例——房屋与价格、尺寸

(1)代码
#1.导入包 import matplotlib.pyplot as plt import numpy as np import pandas as pd from sklearn import linear_model #2.加载训练数据,建立回归方程 # 取数据集(1) datasets_X = [] #存放房屋面积 datasets_Y = [] #存放交易价格 fr = open('房价与房屋尺寸.csv','r') #读取文件,r: 以只读方式打开文件,w: 打开一个文件只用于写入。 lines = fr.readlines() #一次读取整个文件。 for line in lines: #逐行进行操作,循环遍历所有数据 items = line.strip().split(',') #去除数据文件中的逗号,strip()用于移除字符串头尾指定的字符(默认为空格或换行符)或字符序列。 #split(‘ '): 通过指定分隔符对字符串进行切片,如果参数 num 有指定值,则分隔 num+1 个子字符串。 datasets_X.append(int(items[0])) #将读取的数据转换为int型,并分别写入 datasets_Y.append(int(items[1])) length = len(datasets_X) #求得datasets_X的长度,即为数据的总数 datasets_X = np.array(datasets_X).reshape([length,1]) #将datasets_X转化为数组,并变为1维,以符合线性回归拟合函数输入参数要求 datasets_Y = np.array(datasets_Y) #将datasets_Y转化为数组 #取数据集(2) '''fr = pd.read_csv('房价与房屋尺寸.csv',encoding='utf-8') datasets_X=fr['房屋面积'] datasets_Y=fr['交易价格']''' minX = min(datasets_X) maxX = max(datasets_X) X = np.arange(minX,maxX).reshape([-1,1]) #以数据datasets_X的最大值和最小值为范围,建立等差数列,方便后续画图。 #reshape([-1,1]),转换成1列,reshape([2,-1]):转换成两行 linear = linear_model.LinearRegression() #调用线性回归模块,建立回归方程,拟合数据 linear.fit(datasets_X, datasets_Y) #3.斜率及截距 print('Coefficients:', linear.coef_) #查看回归方程系数(k) print('intercept:', linear.intercept_) ##查看回归方程截距(b) print('y={0}x+{1}'.format(linear.coef_,linear.intercept_)) #拟合线 # 4.图像中显示 plt.scatter(datasets_X, datasets_Y, color = 'red') plt.plot(X, linear.predict(X), color = 'blue') plt.xlabel('Area') plt.ylabel('Price') plt.show()(2)结果
Coefficients: [0.14198749] intercept: 53.43633899175563 y=[0.14198749]x+53.43633899175563

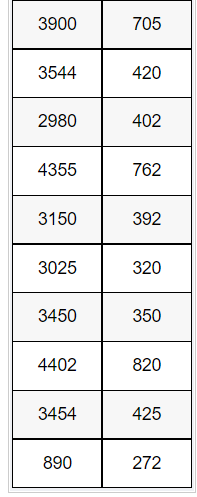
(3)数据
第一列是房屋面积,第二列是交易价格


到此这篇关于人工智能—Python实现线性回归的文章就介绍到这了,更多相关 Python实现线性回归内容请搜索0133技术站以前的文章或继续浏览下面的相关文章希望大家以后多多支持0133技术站!
以上就是人工智能—Python实现线性回归的详细内容,更多请关注0133技术站其它相关文章!


