这篇文章主要介绍了解决echarts中饼图标签重叠的问题,具有很好的参考价值,希望对大家有所帮助。一起跟随小编过来看看吧
饼图中的series有个avoidLabelOverlap属性,
avoidLabelOverlap:是否启用防止标签重叠策略,默认开启,在标签拥挤重叠的情况下会挪动各个标签的位置,防止标签间的重叠。
当avoidLabelOverlap设置为false时会出现以下情况
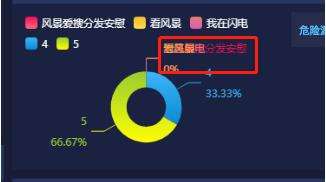
改为true之后就不会重叠

代码如下
 var option = { tooltip: { trigger: "item", formatter: "{a}
{b} : {c} ({d}%)" }, legend: { //orient: "vertical", x: "0%", //y: "25%", //y: "5%", itemWidth: 14, itemHeight: 14, align: "left", data: xData, textStyle: { color: "#fff" } }, series: [ { name: "危险源状态", type: "pie", radius: ["25%", "45%"], center: ["50%", "60%"], avoidLabelOverlap: true,//对,就是这里avoidLabelOverlap label: { normal: { show: true, position: "center" }, emphasis: { show: true, textStyle: { fontSize: "12", fontWeight: "bold" } } }, labelLine: { normal: { show: true } }, data: pieData } ] };补充知识:echarts柱状图轻松实现分别采用两个不同单位的y轴
echarts柱状图轻松实现分别采用两个不同单位的y轴:

秘籍:

代码
// 基于准备好的dom,初始化echarts实例 var colors = ['#0089FF','#B865DF',/*'#5ADF63','#FFDD00',*/'#224666', '#675bba']; // 指定图表的配置项和数据 option = { /*grid:{ y:'25%'},*/ color: colors, /* title: { text: '各医院指标对比情况', left: 16, textStyle: { fontSize: 18, color:'#0089FF' } },*/ tooltip: { trigger: 'axis', axisPointer: { type: 'cross', crossStyle: { color: '#999' } } }, legend: { data:['组数','CMI'], x:'80%' }, xAxis: [ { type: 'category', data: arr, axisPointer: { type: 'shadow' }, axisLine: { show: true, /* lineStyle: { color: '#05edfc' }*/ }, axisLabel: { show: true, /* color: '#fff',*/ fontSize: 12, interval: 0, formatter:function(value) { return value; } //fontWeight: 'bold' } }, ], yAxis: [ { type: 'value', name: '组数整体指标', position: 'left', splitLine:{show: true}, axisLine: { show: false, /* lineStyle: { color: '#E7E7E7' }*/ }, axisLabel: { show:true, showMinLabel:true, showMaxLabel:true, formatter: '{value}' }, }, { type: 'value', name: 'CMI', position: 'right', splitLine:{show: true}, axisLine: { show: false, /* lineStyle: { color: '#E7E7E7' }*/ }, axisLabel: { show:true, showMinLabel:true, showMaxLabel:true, formatter: '{value}' }, }, ], series: [ { name:'组数', type:'bar', barWidth : 20, data:arr2, yAxisIndex: 0, /* markPoint : { data : [ {type : 'max', name: '最大值'}, {type : 'min', name: '最小值'} ] }*/ }, { name:'CMI', type:'bar', barWidth : 20, data:arr3, yAxisIndex: 1, /* markPoint : { data : [ {type : 'max', name: '最大值'}, {type : 'min', name: '最小值'} ] }*/ } ] };以上这篇解决echarts中饼图标签重叠的问题就是小编分享给大家的全部内容了,希望能给大家一个参考,也希望大家多多支持html中文网。
以上就是解决echarts中饼图标签重叠的问题的详细内容,更多请关注0133技术站其它相关文章!


