本文主要讲解了canny边缘检测原理:计算梯度幅值和方向、根据角度对幅值进行非极大值抑制、用双阈值算法检测和连接边缘以及python 实现
canny边缘检测原理
canny边缘检测共有5部分组成,下边我会分别来介绍。
1 高斯模糊(略)
2 计算梯度幅值和方向。
可选用的模板:soble算子、Prewitt算子、Roberts模板等等;
一般采用soble算子,OpenCV也是如此,利用soble水平和垂直算子与输入图像卷积计算dx、dy:

进一步可以得到图像梯度的幅值:

为了简化计算,幅值也可以作如下近似:

角度为:

如下图表示了中心点的梯度向量、方位角以及边缘方向(任一点的边缘与梯度向量正交) :

θ = θm = arctan(dy/dx)(边缘方向)
α = θ + 90= arctan(dy/dx) + 90(梯度方向)
3、根据角度对幅值进行非极大值抑制
划重点:是沿着梯度方向对幅值进行非极大值抑制,而非边缘方向,这里初学者容易弄混。
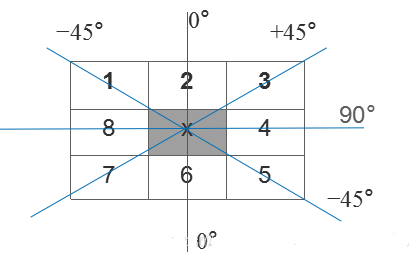
例如:3*3区域内,边缘可以划分为垂直、水平、45°、135°4个方向,同样,梯度反向也为四个方向(与边缘方向正交)。因此为了进行非极大值,将所有可能的方向量化为4个方向,如下图:


即梯度方向分别为
α = 90
α = 45
α = 0
α = -45
非极大值抑制即为沿着上述4种类型的梯度方向,比较3*3邻域内对应邻域值的大小:
在每一点上,领域中心 x 与沿着其对应的梯度方向的两个像素相比,若中心像素为最大值,则保留,否则中心置0,这样可以抑制非极大值,保留局部梯度最大的点,以得到细化的边缘。
4、用双阈值算法检测和连接边缘
1选取系数TH和TL,比率为2:1或3:1。(一般取TH=0.3或0.2,TL=0.1);
2 将小于低阈值的点抛弃,赋0;将大于高阈值的点立即标记(这些点为确定边缘 点),赋1或255;
3将小于高阈值,大于低阈值的点使用8连通区域确定(即:只有与TH像素连接时才会被接受,成为边缘点,赋 1或255)
python 实现
import cv2 import numpy as np m1 = np.array([[1, 0, -1], [2, 0, -2], [1, 0, -1]]) m2 = np.array([[1, 2, 1], [0, 0, 0], [-1, -2, -1]]) from matplotlib import pyplot as plt # 第一步:完成高斯平滑滤波 img = cv2.imread("B9064CF1D57871735CE11A0F368DCF27.jpg-600", 0) sobel = cv2.Canny(img, 50, 100) cv2.namedWindow('5', 0) cv2.resizeWindow("5", 640, 480) cv2.imshow("5", sobel) # 角度值灰度图 img = cv2.GaussianBlur(img, (3, 3), 2) # 第二步:完成一阶有限差分计算,计算每一点的梯度幅值与方向 img1 = np.zeros(img.shape, dtype="uint8") # 与原图大小相同 theta = np.zeros(img.shape, dtype="float") # 方向矩阵原图像大小 img = cv2.copyMakeBorder(img, 1, 1, 1, 1, borderType=cv2.BORDER_REPLICATE) rows, cols = img.shape for i in range(1, rows - 1): for j in range(1, cols - 1): Gy = [np.sum(m2 * img[i - 1:i + 2, j - 1:j + 2])] #Gy = (np.dot(np.array([1, 1, 1]), (m2 * img[i - 1:i + 2, j - 1:j + 2]))).dot(np.array([[1], [1], [1]])) Gx = [np.sum(m1 * img[i - 1:i + 2, j - 1:j + 2])] #Gx = (np.dot(np.array([1, 1, 1]), (m1 * img[i - 1:i + 2, j - 1:j + 2]))).dot(np.array([[1], [1], [1]])) if Gx[0] == 0: theta[i - 1, j - 1] = 90 continue else: temp = ((np.arctan2(Gy[0], Gx[0])) * 180 / np.pi)+90 if Gx[0] * Gy[0] > 0: if Gx[0] > 0: # 第一象线 theta[i - 1, j - 1] = np.abs(temp) else: # 第三象线 theta[i - 1, j - 1] = (np.abs(temp) - 180) if Gx[0] * Gy[0] <0: if gx[0]> 0: # 第四象线 theta[i - 1, j - 1] = (-1) * np.abs(temp) else: # 第二象线 theta[i - 1, j - 1] = 180 - np.abs(temp) img1[i - 1, j - 1] = (np.sqrt(Gx[0] ** 2 + Gy[0] ** 2)) for i in range(1, rows - 2): for j in range(1, cols - 2): if (((theta[i, j] >= -22.5) and (theta[i, j] <22.5)) or ((theta[i, j] <= -157.5) and (theta[i, j] >= -180)) or ((theta[i, j] >= 157.5) and (theta[i, j] <180))): theta[i, j] = 0.0 elif (((theta[i, j] >= 22.5) and (theta[i, j] <67.5)) or ((theta[i, j] <= -112.5) and (theta[i, j] >= -157.5))): theta[i, j] = -45.0 elif (((theta[i, j] >= 67.5) and (theta[i, j] <112.5)) or ((theta[i, j] <= -67.5) and (theta[i, j] >= -112.5))): theta[i, j] = 90.0 elif (((theta[i, j] >= 112.5) and (theta[i, j] <157.5)) or ((theta[i, j] <= -22.5) and (theta[i, j] >= -67.5))): theta[i, j] = 45.0 ''' for i in range(1, rows - 1): for j in range(1, cols - 1): Gy = [np.sum(m2 * img[i - 1:i + 2, j - 1:j + 2])] #Gy = (np.dot(np.array([1, 1, 1]), (m2 * img[i - 1:i + 2, j - 1:j + 2]))).dot(np.array([[1], [1], [1]])) Gx = [np.sum(m1 * img[i - 1:i + 2, j - 1:j + 2])] #Gx = (np.dot(np.array([1, 1, 1]), (m1 * img[i - 1:i + 2, j - 1:j + 2]))).dot(np.array([[1], [1], [1]])) if Gx[0] == 0: theta[i - 1, j - 1] = 90 continue else: temp = (np.arctan2(Gy[0], Gx[0])) * 180 / np.pi) if Gx[0] * Gy[0] > 0: if Gx[0] > 0: # 第一象线 theta[i - 1, j - 1] = np.abs(temp) else: # 第三象线 theta[i - 1, j - 1] = (np.abs(temp) - 180) if Gx[0] * Gy[0] <0: if gx[0]> 0: # 第四象线 theta[i - 1, j - 1] = (-1) * np.abs(temp) else: # 第二象线 theta[i - 1, j - 1] = 180 - np.abs(temp) img1[i - 1, j - 1] = (np.sqrt(Gx[0] ** 2 + Gy[0] ** 2)) for i in range(1, rows - 2): for j in range(1, cols - 2): if (((theta[i, j] >= -22.5) and (theta[i, j] <22.5)) or ((theta[i, j] <= -157.5) and (theta[i, j] >= -180)) or ((theta[i, j] >= 157.5) and (theta[i, j] <180))): theta[i, j] = 90.0 elif (((theta[i, j] >= 22.5) and (theta[i, j] <67.5)) or ((theta[i, j] <= -112.5) and (theta[i, j] >= -157.5))): theta[i, j] = 45.0 elif (((theta[i, j] >= 67.5) and (theta[i, j] <112.5)) or ((theta[i, j] <= -67.5) and (theta[i, j] >= -112.5))): theta[i, j] = 0.0 elif (((theta[i, j] >= 112.5) and (theta[i, j] <157.5)) or ((theta[i, j] <= -22.5) and (theta[i, j] >= -67.5))): theta[i, j] = -45.0 ''' # 第三步:进行 非极大值抑制计算 img2 = np.zeros(img1.shape) # 非极大值抑制图像矩阵 for i in range(1, img2.shape[0] - 1): for j in range(1, img2.shape[1] - 1): # 0度j不变 if (theta[i, j] == 0.0) and (img1[i, j] == np.max([img1[i, j], img1[i + 1, j], img1[i - 1, j]])): img2[i, j] = img1[i, j] if (theta[i, j] == -45.0) and img1[i, j] == np.max([img1[i, j], img1[i - 1, j - 1], img1[i + 1, j + 1]]): img2[i, j] = img1[i, j] if (theta[i, j] == 90.0) and img1[i, j] == np.max([img1[i, j], img1[i, j + 1], img1[i, j - 1]]): img2[i, j] = img1[i, j] if (theta[i, j] == 45.0) and img1[i, j] == np.max([img1[i, j], img1[i - 1, j + 1], img1[i + 1, j - 1]]): img2[i, j] = img1[i, j] # 第四步:双阈值检测和边缘连接 img3 = np.zeros(img2.shape) # 定义双阈值图像 # TL = 0.4*np.max(img2) # TH = 0.5*np.max(img2) TL = 50 TH = 100 # 关键在这两个阈值的选择 for i in range(1, img3.shape[0] - 1): for j in range(1, img3.shape[1] - 1): if img2[i, j] TH: img3[i, j] = 255 elif ((img2[i + 1, j] 运行结果如下


以上就是python实现canny边缘检测的详细内容,更多关于canny边缘检测的资料请关注html中文网其它相关文章!
以上就是python实现canny边缘检测的详细内容,更多请关注0133技术站其它相关文章!


